Deconfusing Healthcare through Taxonomy Inquiry

This winter,  I had an opportunity to participate in an information research team that had a chance to interview top executives in health care in Massachusetts.  This included the CEOs of insurance companies,  regulators from the Attorney General’s office, and medical directors of major medical networks and hospitals.   The goal of this project was to understand one term  “Cost Containment”   — what are the drivers for rising health care costs and what can be done to slow the rate of growth.

When someone with taxonomy skills participates in these types of investigations, it is hard not to put those taxonomy skills to work. What did I learn from this process that might be applicable to best practice and to understanding health care cost containment?

1) Start with a  simple but important question  as a guide for developing deeper knowledge

This group started with the question  “What is cost containment?”   It is a fairly fundamental question since we in Massachusetts are fortunate to have universal coverage (about 97%)  but there is a need to control costs.  By asking this fundamental question. the group could  collect basic facts from each key player on the same topic   to understand how proposed strategies are defined from the point of view of key players who are shaping policy.

2) Get to know the cast of characters

Remember the adage that the key to a baseball game is to know the players and the same applies to understanding a complex issue. We need to  who the users are, what brought them to these meetings,  It is critical to  identify the constituencies in healthcare, all of whom have different goals in any situation.   The key actors we indentified were:

  • Insurers (also known as Payers)
  • Providers (Hospitals, Doctors, Specialists)
  • Regulators (government, legislature, attorney general)
  • Consumers (includes business owners, patients, local government)
  • Purchasing agents (people who buy insurance for large groups — government, business, insurance agents)
The above list is a top level of the Actors/Player facet which further breakdowns.  Insurers for example is further categorized into companies, corporate structure (profit/non-profit), market share.    Not all the groups under these broad headings share characteristics.  For examples, we rarely saw a “specialist” at  a meeting on cost containment, but other types of medical personnel including primary care, psychiatrists, behavior medicine, were well represented because they, as a group, lower reimbursement and higher volume than specialists.  Grouping does not mean all values are inherited  — thus the need for understanding power relationships and attributes.

3) Understand the power relationships

Some actors have more power and are core to the discussion.  Insurers and providers have a closer affinity for example, while consumers, including employees,  business and local government entities tend to have less to no power in these relationships.  Hospitals and specialists have more power than primary care and behavioral medicine.  Understanding these internecine wars within health care is a key analysis for understanding core relationships and who is outlying.  The health care debate is in part about how to give outliers more power and equity in the health care process. The most outlying of all voices is patients and consumers.  Theoretically,  in new models of health care, their voice is supposed to be represented by larger purchasing pools who can negotiate for better service at less cost.

4) Identify  the key cost drivers —  Isolate the attributes 

The hardest part of this work is to isolate the variables/attributes  or cost drivers, and understand how each group contributes to improving these practices.  These are topics that should be of mutual concern but that are  not universally understood and standardized.  Examples of cost drivers included:

  • Use of and dissemination of best practices (end-of-life care, chronic diseases)
  • Use of Technology
  • Number  and Variety of Insurance Plans
  • Cost of drugs
  • Reimbursement rates
  • Risk Management (use of defensive medicine, malpractice, high-risk pools)

Each of these attributes needed to be further understood from perspective of the key players to understand how it contributes to cost.  For example, Massachusetts has an excellent universal health care law, where consumers can choose from about 18 different plans over the Connector, but in addition, there are additional public, private and individual plans resulting in over 16,000 different plans.   Some cost containment could be achieved by having a “shared minimal contract” that is at a high standard of care, and captures essence of basic wellness.  To do this, the players and consumers need to find the common language for describing conditions and coverage.

5) Capture the AS IS Definitions.

Since these conditions and coverage are not standardized,  it is useful to understand what the current status is.   Understanding AS IS definitions help to capture the many disconnects between group. For example, while consumers argue about cost of deductibles, insurance companies might spend more money in order to reduce high cost of hospitalization.  Result is like a balloon filled with water — one end gets leaner, while more pressure is put on another end of the balloon — the consumer.    Capturing the cacophony, instead of the symphony, turned out to be the most valuable part of the work. We discovered we did not have to reach common understanding, which meant trying to capture the current status and its impacts.

6) Read background content

In addition to understand the “cast and drivers”  it is also important to read studies and literature to keep a broad and balance perspective. Being in rooms with charming and knowledgeable power players can be quite intoxicating, but to keep it honest, we needed to keep reading and we needed to ask honest questions about what was the advantage for each player in their advocacy for a certain program.   Spending a few hours each week on literature reviews, books, articles, podcasts on general health care was very important to building our group and individual knowledge base and developing our facility in the terminology of health care economics.  We used reading to define comparative health care models in other countries (Taiwan, Switzerland, Japan, Canada, Germany, UK, France, and US) and to understand multiple models of healthcare delivery.

7) Capture concepts in simple diagrams

Even within our small, random  data collection group, there were divisions in understanding can be quite diverse.  Using simple diagrams to capture concepts  turned out to be powerful shared way to come to common understanding.  Bubble mapping, graphing, hierarchical diagrams, any visual graph was useful to clarify information.

8)  If any term is hard to explain with a simple sentence, it probably deserves a taxonomy

“Cost containment”  is not trivial,  but it is also important to understand. And it is almost  impossible to explain without learning something about healthcare system.   It is worthy of the time and effort to create a taxonomy to define the information space or information void, and a void is filled by misunderstanding or misinformation.

Developing a consumer-focussed taxonomy for navigating health care  turns out to be valuable work, but it is hard to sustain without a dedicated team with and sustained funding.  A consumer-focused taxonomy would help  navigate the health care debate, can be used across all actors, including   insurers, providers, governmental entities  and consumers who want to share information with a confused but curious public.

~ Marlene Rockmore

External User-facing Search and Taxonomies

Search has become faster, cheaper and more intelligent since the days of inverted single word engines so why not just use a search engine.  Why bother with taxonomy? Let’s briefly revisit what search is suppose to do. A search engine needs to make a pretty good guess of what a user wants to find – an unspoken intent which is expressed in staccato keywords  and then search needs to  match the user query with some content (documents, data, digital objects, people with expertise, adserving, product information), and take some action such as  read, buy, forward, share, comment, browse…..Sometimes the match is exact, sometimes the query terms are a partial match and sometimes there is no match.

In other words, search is not a perfect art.  The units of this equation are not just search  engine.  It is also the quality of the content and the query.   Good search needs good content,  no matter how great the technology.

Someone responsible for search implementation  has limited control over two of the key ingredients of search – the technology and the content.  This is why taxonomy plays a role – it can help describe concepts not in the content or in the metadata about the content.  (metadata is particularly useful for digitizing non-digital objects).   Taxonomy is not always necessary –  If you can write custom content with very precise vocabulary using Search Engine Optimization (SEO) techniques might not need a taxonomy. But documents cannot be altered, such as emails or reports, where it would be a significant protocol violation, even illegal.  When is search not enough?

1)  Developing effective measures to assess when search is not enough – the 80/20 rule

As part of the some of the early work in faceted taxonomies I did, I spent some time at MIT working on a research project that compared results when we queried a system that was based on a search engine technology alone,  and when we queried one where the query could be enhanced by adding taxonomy terms. For this experiment, we had the advantage of using a system, that was the brainchild of Wendi Pohs,  in which we had 2 search engines  using the same technology processing similar documents that were made available to a user interface which had a simple search box like Google. One engine processed news feeds .  These feeds were added quickly with no intervention—directly loaded into a search engine.   What our research found was that search engines without a taxonomy, left unattended, flatlined. The recall never improved over 75-80%.   Lee Romero, who is a keen observer of search, has recently done an excellent blog post observing this same flatline phenomenon.

What to do when you want to do better than 80% and move the flatline

In the same experiment, we created second engine, using the same software, had a taxonomy function where we inserted taxonomy terms into the index. These terms were selected from query logs and analytic reports-  they were unmatched terms, misspellings,  abbreviations.   There was an added cost to add taxonomy terms, but there was no impact on speed or performance of search since search technology used the same engine.

The taxonomy  was divided into classes such as product, company, or subject. Each term was connected to another term by using user-defined cross- connections (associative terms) which was smart enough to infer other relevant terms.  At least one of these terms  in the linked sets had to be tagged by an indexer.  So,  if a product was tagged, then we could infer that the product was <made_by> a company, thus speeding the tagging process.  Taggers could override the automated suggestions, and/or add new rules, by the way.  This way we could ensure exhaustive indexing at a low cost and effort.  The taxonomy-controlled section  paid back this effort.  A search on this section  would recall content that matched user-query terms about 90% of the time.  The taxonomy-controlled part of the database  could be improved.  We also worked hard to acquire content- good content- in many formats that would improve the quality of the database and thus what goes into an engine.

By using reports, tools and measurements, we were able to proactively add equivalents and monitor emerging terms.    Dips in performance triggered action to understand what was changing in the user’s world – was it query terms, a search for emerging content, or other unmet needs.

Errors were due to 1) missing content 2) wrong application 3)new terms or spelling errors that could be quickly added to taxonomy and 4) new and emerging trends that users were identifying that had not yet been captured in the taxonomy – all issues that could be identified and corrected.For example,  in the recent flu season,  search engines would eventually learn that  H1N1 was the preferred term to Swine Flu,  but in some cases, it was much easier for a trained taxonomy editor to surgically make this connection (especially in a fast moving news and business cycle). In a search engine only scenario, these errors are not always identifiable not actionable.

Set realistic goals and explanations for what taxonomy can do

ROI discussion often mean conversations that start or end with “Taxonomy can increase sales by improving conversion”  or “lower costs.”   Here are a few reasons that might be more honest and even compellng

Help with Ambiguity and add Precision —  Use Faceted Navigation: Search engines have a hard time differentiating about very key concepts and terms.    I remember in the early days when a term like “ASK” would bring a search engine to its knees because it couldn’t tell the difference between the name of  system command or a computer company.   By sorting terms into facets, we could help differentiate and resolve ambiguity by navigating user to the right facet and by tagging more precisely.   A developer looking for information on Java applications shouldn’t be sent to Java the island.  Taxonomy can help keep users searching down paths that might lead to results that are useful.  That’s productivity.

Implement Universal Search: A taxonomy can be implemented independently from the content, which means it can be used across content types- blogs, videos, email – creating a common set of concepts from which to generate user-centered search.   That’s efficiency and smart use of limited resources.  You need to have common metadata or rdf to take advantage of universal search, but there are standards such as Dublin Core that can help jumpstart that conversation.

Think Scalability and Reuse: Taxonomy can be used across applications, which means a central, faceted taxonomy, can be reused by other applications.  The best practice however is to create smaller taxonomies that are divided into homogenous facets.   To design monolithic spaghetti-like taxonomies will, in the end, create more work, bad inferences, and sour you on the whole project.  Reuse and scalability avoid redundant efforts.  Cost savings.

Use Taxonomies to Manage Change: Since taxonomy is independent of the content, you can change the concepts in the taxonomy without impacting the content.   Taxonomies are NOT static. For example,  many organizations need to change organizational names.  These names can be subsumed in a taxonomy without impacting the existing content. It’s safer and more secure way to handle change.

Create a technical and cost plan to integrate taxonomy while maintaining speed and performance, and not adding to overhead costs.

Implementing taxonomy within search can be done at various price points —  a solution like Vivismo  is not within every budget but there are other options low cost  and effective alternatives  I’ve found include:   Here are some technical considerations in adding taxonomy.

  • You don’t need a high end faceted navigation tool to get benefits of faceted navigation. Faceted navigation allows a user to narrow or broaden or expand query at time of search. This can be done in many CMS systems including  Drupal.   WordPress, which is what I use for this blog, has a taxonomy module, allows multiple authors
  • Add custom fields or metadata  for tagging that could be loaded into the search engine to improve search (as SOLR does)
  • If you have the budget and requirement for high-thoughput as in  auto-classification and text analytics, as in nStein, Teragram or Vivismo, then taxonomy is  still very useful to improve precision of results and making collections within document sets.

The bottom line is that whether you use search engine, you should be confident that 80% of the time, the user will get what they want. If you need to find ways to improve the user experience, taxonomy is one highly viable, low-cost and effective option.  Taxonomy might be worth looking as a way to give a  insert a pacemaker into the heart of  a search engine that seems to have flatlined.

Once you have a backbone with classy taxonomies and metadata, you can then proceed to the creative activity of beautiful designs of navigation paths for your end users.  But keep your eye  For more on search and taxonomies, see also my prior book review of Peter Morville’s  Search Patterns.

~ Marlene Rockmore

Enhanced by Zemanta

The Mars Test

A recent segment on NPR discussed with New Yorker writer Peter Hessler, who has lived in China for the past 15 years, what it was like to re-enter life in the United States and how United States looks to Chinese citizens.  Hessler discussed how hard it is for the rest of the world to understand our complex system of check and balances, of federal, state and local power, of influential groups with non-governmental status.    So that raised the question of what governmental websites do to help orient visitors to what the basic organization and framework of government.

What if we were visiting from Mars?  What would we learn from our governmental websites about how the United States is organized.   The Mars test, in taxonomy and information design, is also called the ‘mental model.’  A mental model uses common knowledge or frameworks for creating website navigation.  So a good place to start design a US Government website might be with 4th grade civics, which distinguishes Executive and administration, Legislative, and Judicial Branches and explain responsibilities of federal government and those functions reserved for state government.

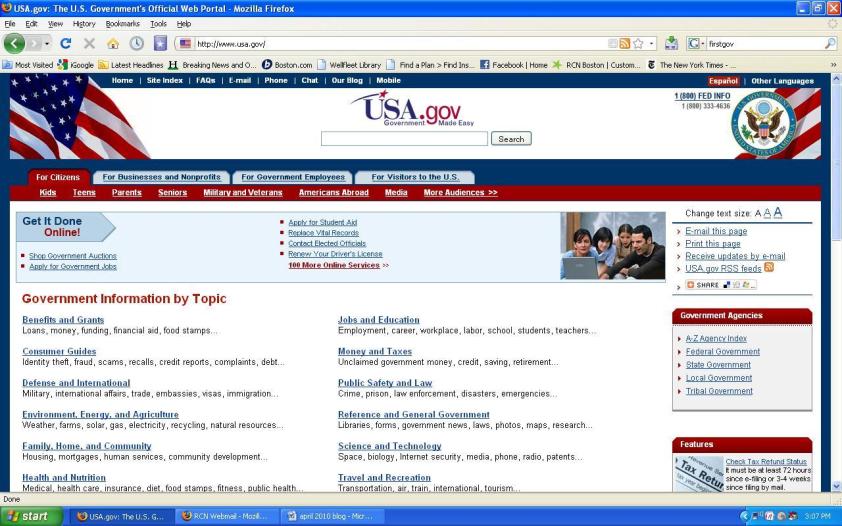
Here is the US Government portal called USA.gov.  Does it pass the Mars test?

USA.gov on April 16, 2010

It is a directory like interface  that is organized, it seems to me, based on arbitrary topics with no association to government agencies. Where would I even begin to find out about the President of the United States, the new health care bill, the Supreme Court?  How do you find a local office of a government office like my legislator’s office or the social security office.  In a week where a United States Supreme Court justice retired and volcanic ash disrupted air travel, there is no acknowledgment of these events or links to related website.  The site in fact gives an impression that lights are on but nobody is home.

USA.Gov.com  is actually experimenting with some sophisticated clustering software such as  Vivisimo (vivisimo.com).  This clustering application illustrates how clustering results can be customized in this case by topic, by agency and by sources. While the topic clusters are automatically generated on-the-fly, the agency and source filters are generated based on HTML metatags.

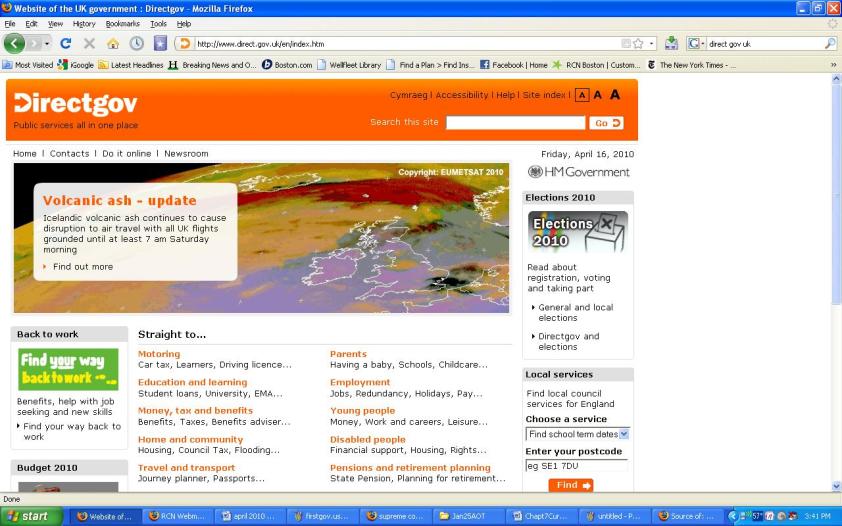
The United Kingdom is experimenting with its own clustered interface but the site also uses  RDFa and shared metadata. This system has the advantage of having a reusable metadata model that can allow state and local agencies map their content to the governmental model.  This promotes “harmonization” and cooperation in supplying data between federal and state government.  Because of this harmonization through use of shared metadata,  directgov.uk can enable features such as search by zipcode for local offices that deliver state and local services.  Even better, the interface looks like someone is minding the store and cares what content appears on the website.

Direct.Gov.UK April 16, 2010

I am not opposed to clustering.  Clustering promises to be a great technology to quickly retrieve masses of documents and content, but a little upfront work is needed to filter automated technologies into useful categories that reflect our  shared  knowledge and common sense.  This work  would help in  creating automated systems that sort results into useful buckets that clarify content and help users find government assistance and  solutions.

Search.usa.gov is actually an exciting engine that has clustered over 50 million government documents.  However it needs a friendlier, warmer interface to the experience.   For example search for  Supreme Court, and results  mixes state courts with the United States Supreme Court.  Wouldn’t  search experience  be improved if the portal to the search engine helpe users  understand and  filtered  searches to distinguish between by federal and  state courts.

Using common models through taxonomies and shared metadata might not only help the visitors from Mars.  It might also help citizens of the United States find a clearly navigable path based on stuff they learned in 4th grade.

Reblog this post [with Zemanta]

The Right Prescription for a Crowd-source Experiment

My last post was an experiment in using remote online card sorting as a way to build a taxonomy.  And why start small.  My sample data was the picklist used on www.medicare.gov when you  search on “What does Medicare Cover?”   For my experiment, I used websort.net. as the remote card sorting tool.

First, let’s start with the good news.  Online tools are basically very cool way to bring together remote groups where it would be too expensive or politically impossible to connect.  That’s the promise.

But to have a successful  remote card sort requires  preliminary planning and work.   Here are my lessons learned:

  • Keep the test under 20 minutes: Online card sorting is a time-consuming task for the participant, so for the experiment to be successful,  you need to make sure that participants have the time and that the number of terms to be sorted are not overwhelming. Joseph Busch of Taxonomy Strategies and Dave Cooksey, saturdave.com suggest 20 minutes/25 terms at most.  My comprehensive test  of all 132 picklist terms from the Medicare site was too big.
  • Pretest the taxonomy: Since the card-sorting activity is a one-time opportunity to  engage testers , some prior testing of the taxonomy should occur.  Remote card sorting is better for closed experiment where a taxonomy has been designed, rather than an open card sort where the goal is to discover categories and facets.   The best practice recommendation is to run some prior tests of the taxonomy before that online experiment.  Have a trusted expert do the test, and then throw away obvious problems.  If the pre-test doesn’t go well,  try again.   Testers in an online setting have a low tolerance for obvious problems, so the test needs to  about validating  a good design.
  • Choose online tools carefully: The tool I used, websort.net, had a major problem.  It only allowed a term to be classified under one and only category.  This proved frustrating to users. For example, users wanted to classify durable medical equipment under the category for Equipment but also under the category for the Disease or Chronic Condition.   Dave Cooksey, who tracks tools, says remote tools are improving all the time  — so evaluate tools and choose wisely.
  • Be sure to thank the participants: We all feel manipulated by many of the group activities we attend in the face-to-face world, and that can happen in the remote world as well.   Being authentic and courteous is important. Provide a thank you and be sure to share results or feedback.  If possible, consider some kind of compensation such as a gift card.

So given that a test that seems so simple on the surface requires work to set up, what is the value of this work. The purpose of a taxonomy is to determine top level facets that can be used to organize and search for information.  If we look at a topic like Medicare, we know that we have a national problem determining standards for insurance policies.  It is difficult to compare policies, and it is also time-consuming to manage the costsIn designing good remote crowdsourced  card sorting tests, Dave and Joseph have the following recommendations

  • Pay attention to the sample size
  • Recruit carefully to be sure the sample has balance of perspectives
  • Run tests prior to online activity. Have experts try the test.
  • Remember the goal of a taxonomytest is to find the higher level categories that overlap between the technical expertise and general understanding.
  • The result is a better analysis of shared group understanding – shared mental models of how we collectively categorize concepts,  not individual understanding

In the scheme of a trillion dollar problem like health care, a project to set up  well-designed remote cards sorts that can compare how different user groups sort fundamental medicare concepts seems like a small investment.   A well-run test with a good recruitment could be a very good way to jumpstart better designs of  websites such as Medicare  that deliver  clearer information about benefits and choices.

Reblog this post [with Zemanta]

Using Taxonomies to Sort through Health Care Reform

I am very interested in the health care reform debate, thus I wanted to know what a public option might look like. I was told by my sources that a robust public option might look a bit like Medicare. So off I went to the Medicare.gov website to find out what was covered.   In the middle of the home page in the second column, there is  a link to ‘Find Out What is Covered, ” which leads to an advanced search criteria page. The search page  includes picklist of about 143 topics,  just the right size for a sample set of candidate terms  for a card sort.

This month, I am offering a small interactive experiment in online card sorting.   Taxonomies are collections of facets, which are created by organizing concepts into categories.  Card sorting is one of the best ways to identify categories by having controlled tests with groups of users to create categories, that can be validated through repeated tests, until there a consensus.  In health care reform, taxonomies might be useful to help create consumer-friendly interfaces to help search across the national insurance exchanges.

A card sort method uses the following steps:

  • Collect a sample set of candidate concepts
  • Group or cluster terms into categories
  • Refine the design iteratively until there is a set of facets, groups of categories that have similar properties

I’ve put 130+  topics from Medicare into an online card sorting tool called Websort.net.  The topics have not been formatted or massaged; they are just as they appear the Medicare search picklist.   Websort.net suggests  that I use a closed card sort,  where participants sort terms into predetermined categories. So to get  started,   I’ve come up with about 20 starter categories.   Some of these categories will become subtopics in a faceted design

The experiment is open to the first 10 participants who want to take the time to try this task.   To try the card sort, link to

http://websort.net/s/80CDD6/

Please feel free to assign terms to multiple categories or to suggest other categories.

Last month, Joseph Busch blogged about the judicious use of online web sorting tools – that they may not be the most cost-effective way to build taxonomies. One of his arguments is that the sample set of users will not be random. That’s true. This blog has a small readership who have interest in taxonomies, and probably have a consumer’s interest in health care reform. Let me know what you think of websort.net.

This little experiment could help demonstrate some bigger observations. Government may be looking to advanced high volumentechnologies such as clustering or semantic technologies to identify categories and to map claims data.   Perhaps one of the applications will be  to build interfaces that will help consumers search across the national exchanges.  But at the core of these technologies, there will be a need for well-designed taxonomies to help analyze text and building better interfaces to access health care information.

A well-designed taxonomy with facets and linking relationships can

  • Group information into useful categories
  • Identify gaps in coverage
  • Help point to important related information

Let’s find out if taxonomy design can help us sort through health care reform.

Thanks to Andy Oram and the Sunlight Foundation for introducing me to this tool and to Dave Cooksey who is virtually updating my card-sorting skills.

What’s wrong with crowdsourcing the design of public websites?

A blog post from Sunlight Labs on “Redesigning the FCC: Getting Organized” suggests an experiment that employs a public card-sorting program, websort.net, to help redesign the Federal Communications Commission (FCC) website.  The FCC has a notoriously convoluted web site, hard to navigate and hard to search.  Sunlight Labs invites anyone interested in helping the FCC to this open card-sorting activity, which organizes about 60 terms into categories related to the FCC. But is a public web sort the right approach to redesigning a government website?

Should we crowdsource the design of a public website?

Here are some considerations: –

  • First, the success of any design process depends on who sits at the table. Site designers have not succeeded over the years by roping in anyone who happens to be around. Rather, carefully identifying the right participants for any design activity is very important. Engaging busy professionals and bureaucrats in order to derive the maximum impact with the minimum effort is a tricky business. One of the most cutting critiques of the Wikipedia has been that the editorial perspective is overwhelmingly white-male twenty-something—not necessarily the authority of choice for everyone else.
  • Second, open processes tend to be very time-consuming, which works in your favor for some kinds of crowdsourcing but not for selecting terms and categories. Unless the sample is large and controlled, the emerging pattern from crowdsourced card sorting may not be helpful because experts with limited time will be overrun by people with lots of time and a fast hand on the keyboard, no matter how much or how little they know. Some types of crowdsourcing (such as prediction markets) work because the errors of ignorant participants cancel each other out and allow the experts to win out—but card sorting is entirely different and results in just chaos.
  • Third, it would be much quicker for the FCC to suggest a model for organizing its content based on its expertise than to crowdsource the design. There are standard ways to organize things, including website content, which people can learn even if they are not entirely natural. We learn about brand, price, size, color, material, and fit because they help us find the stuff we want to buy, not necessarily because there is a shopping gene in our DNA.
  • Fourth, the users of these sites, such as broadcasters, regulators, website publishers, and ordinary people, are not always interested in the same things. The FCC will have to comply with legislative and executive branch imperatives that may be of little interest to many people in the crowd.

A better way to approach website design and redesign focuses on the backend nomenclature—buckets and categories, which are called facets and vocabularies. These form the basis of a useful taxonomy.

So when can crowd-sourcing be used effectively? If the FCC engaged in the process of designing facets and vocabularies, the crowd could be useful as a follow-up. First, it can be helpful in validating a design. After all, the test of a taxonomy is whether it helps people find information. One of the appropriate roles for crowd sourcing in taxonomy is to observe how the users access a collection of items over time, the searches they use, and the click paths they follow. The taxonomy can then be tuned based on how the activity distributes among the categories—splitting and merging categories as warranted.

Another place for crowdsourcing is to allow users to add free-text “tags” to the content. Those tags can then be evaluated to either map them to existing taxonomy categories, or to suggest changes to the taxonomy. In this case the crowd and the taxonomy work together in synergy. Users typically add a tag to only a fraction of the pages, so in most cases these terms will be synonyms or equivalents to existing categories.

Finally, a card-sorting exercise can be useful after the field is carefully constrained by the experts who know the site. The true test of any card-sorting activity is whether people can actually find what they are looking for afterward. Mapping a tag as a synonym of an existing taxonomy category, effectively applies that tag to all the content already in that taxonomy category. This synergy is one method that can help improve access to information.

Here are several techniques that are intuitive and natural for people to use with little or no training, allowing them to validate a taxonomy. These techniques are much faster than open card sorts, and provide results that are easier to interpret.

  • Classifying some content
  • Conducting walk-throughs
  • Closed card sorting

Classifying some content

In this exercise, people are presented with a representative subset of content from the site and are asked to tag it. You can select it randomly or try to include examples of the site’s primary content types, as well as content you think may be hard to tag, find, or use. Plotting the number of items tagged into each taxonomy category, you should expect to see 80% of the content fall into 20% of the categories.

Conducting Taxonomy Walk-Throughs

One-on-one and group presentations to stakeholders showing and explaining or walking through the taxonomy, is an effective way to extract specific comments and sometimes overall approval. During walk-throughs, standard questions should be asked about the category structure, as well as about problematic categories, to gather feedback on the taxonomy. Delphi walk-throughs are done using a stack of cards. It is not a set of raw terms, however, as in the FCC exercise. Instead, the cards are already marked with categories chosen by the experts. Reviewers are asked to mark changes to the category labels on the cards. Each subsequent reviewer is given their walk-through using the cards with the label mark-up from the previous session. The process usually stabilizes after a few sessions, indicating that the categories are appropriate. According to Dave Cooksey, Founder and Principal of saturdave, 20 sessions will usually result in a consensus taxonomy revision, and this method provides results without any further analysis.

Closed Card Sorting

Closed card sorting, where categories are in predefined buckets, can be used to test whether stakeholders and end users consistently sort categories into the correct taxonomy facets. The categories to test should be a set of important topics, such as the most frequently searched words and phrases from the search engine logs. The test can be done using actual cards, or using a simple grid with categories to be tested down the left column and the taxonomy facets across the top. Paper card sorts work well enough for up to 20 trials.

Websort.net is a good tool when you need a larger, distributed closed-card sort test. If users can’t map terms to the categories, the designers will know that they have to adjust their design. But our experience shows that pre-analysis captures about 80% of the common categories and use cases. Sunlight Labs has undertaken a commendable task in seeking to improve the FFC web site’s layout. By carrying out a card sort too quickly, they’ll just get their signals crossed. Performing some professional taxonomy work first will channel public efforts in the right direction.

Submitted by – Joseph A. Busch, Founder and Principal, Taxonomy Strategies,  Sept  8, 2009

Reblog this post [with Zemanta]

Extreme Picklist Makeover

Last winter, the side airbags in my car deployed for no apparent reason. What does this have to do with taxonomy? Well, the subsequent struggle with both the insurance company and the car manufacturer sent me scrambling to the National Highway Safety Transportation Database (www.safercar.gov) to research spontaneous deployments of side curtain airbags when there was no visible damage to wheels, tires or undercarriage.

First, I love government information. Just today I used the U.S. Geological Service and checked information at the Bureau of Labor Statistics but the US Government has to learn how to makeover its picklists and 1.0 databases into an information architecture with usable taxonomies. These ugly ducklings need to become swans.

nhsta defects and recalls

nhsta defects and recalls

Here’s the problem. In a traditional database, every record has to be unique to avoid redundancy so when multiple reports are filed,  all reports are tied back to the original record.  Unfortunately, what happens is that the end-user, who is searching for information in a desperate moment of need such as after an accident, has to find that original record. The record I needed which described a research report about 498 similar complaints was filed in 2006 but was filed under the the original complaint (different year and model) which was a record created in 2003. To find the record that contained a research report filed 3 years after the original complaint, I had to use a year that was prior to the manufacturer of my car, and I was unable to search by the specific component failure as a keyword or phrase. I found the record by using a citation from a Google search where I found a news team investigation of a similar event in a different model. Even with the citation, I had to drill through multiple layers four queries deep to find the original record and I was unable to search by any keywords or topics.

How would taxonomy have helped? A taxonomy would have helped in 2 key ways. First, content management using a taxonomy provides multiple access points related to the same set of topics and issues. A faceted taxonomy would have provided a useful user interface that would have allowed me to alter my search strategy. Searching by model under the existing database design doomed my search to failure because the record I needed was filed under a different model and a different year. Second, the database would have been designed to consider multiple access points to content without sacrificing the benefits of relational database design. It would have simplified the query programming logic, but still allowed an efficient database design.   A good taxonomy design would make it easier to add new facets or terms as technology evolves to search across topics such as environmental issues and engine efficiency.

A quick 2-level redesign of the NHSTA interface might aid searching through a simpler page navigation such as

Vehicle Safety by type

  • Auto Safety
  • Bicycle Safety
  • Motorcycle Safety
  • Light Trucks
  • OffRoad
  • Tractor/Trailer

Driver and Occupant Safety

  • Child safety, car seats and restraints •
  • Teen drivers •
  • Older Population •
  • Population under 5’5”

Traffic Safety

  • Data by state
  • Pedestrian Safety
  • School Transportation Safety

Recalls, Defects, and Complaints

  • By manufacturer/model
  • By component

New Technologies

  • Fuel efficiency

Recent studies

  • Press Room
  • Fact Sheets

Redesigning picklists into taxonomies is not a difficult task for trained taxonomists and projects can be very cost-effective even in a tough economy. In my case, my search led to thousands of dollars of savings in insurance expenses. In other cases, getting good information quickly will help save lives. The hard part is pre-determining what the categories will be captured in the taxonomy, and how databases will be searched by endusers, but that’s why there are taxonomists who can do usability studies and research existing metadata such as insurance reports and consumer safety databases. The taxonomy can also be used to reindex databases through tools that support entity extraction where the taxonomy can be used to find synonymous terms.

After a weekend searching the NHSTA database, I was almost as eager to call the US Government to help provide an “extreme picklist makeover” to transform Web 1.0 picklists into a more searchable 2-level faceted taxonomy as I was to successfully resolve the issue with my vehicle manufacturer. I can’t imagine how anyone without some training or experience would have figured out the logic of the database and constructed a search strategy. By the way, I had a happy resolution with the manufacturer but I am still waiting for the NHSTA to respond to my complaint. One of the changes I am hoping for in the new administration is more attention to our neglected government databases which are in need of “extreme picklist makeovers.” Information has to be easier to find. In some cases, this improved access can save a life, if not thousands of dollars (as was my case).

– Marlene Rockmore